
Kaggle: Quora question pair similarity
Problem statement
To predict which of the provided pairs of questions contain two questions with the same meaning.
Source
Focus area
To achieve a probability of a pair of questions to be duplicates so that you can choose any threshold of choice with minimal misclassification.
Data source
The data is available on Kaggle, features of which are briefly summarised here -
- id - the id of a training set question pair
- qid1, qid2 - unique ids of each question (only available in train.csv)
- question1, question2 - the full text of each question
- is_duplicate - the target variable, set to 1 if question1 and question2 have essentially the same meaning, and 0 otherwise.
Formulating a ML problem
Since the target column is binary (0 - no similarity, 1 - similar), hence it’s a binary classification problem.
The metric as suggested by Kaggle for this competition is Log Loss which is absolutely necessary to predict the certainity of two question similarity in terms of probability. A perfect value of log-loss is 0 and worst is inf.
Exploratory Data Analysis
Loading the data
The data is loaded into a pandas dataframe with nearly 400K rows in train.csv.
Missing data
Only Question 2 has 2 missing values which are filled with blank.
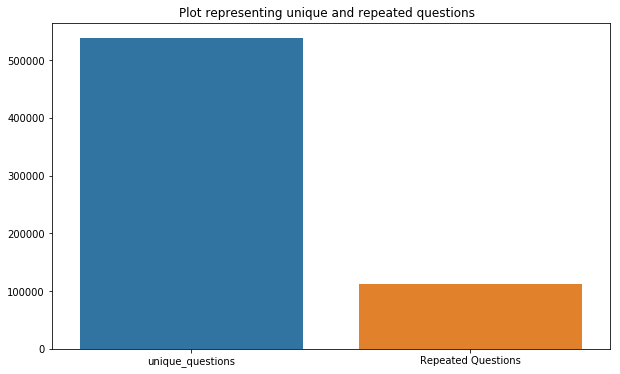
Distribution of target data
There are more number of unique question pairs (63%) as compared to duplicate question pairs.

Number of unique questions combining both columns question1, question2
Total num of Unique Questions are: 537933
Number of unique questions that appear more than one time: 111780 (20.8%). Hence, nearly 80% of questions are unique.
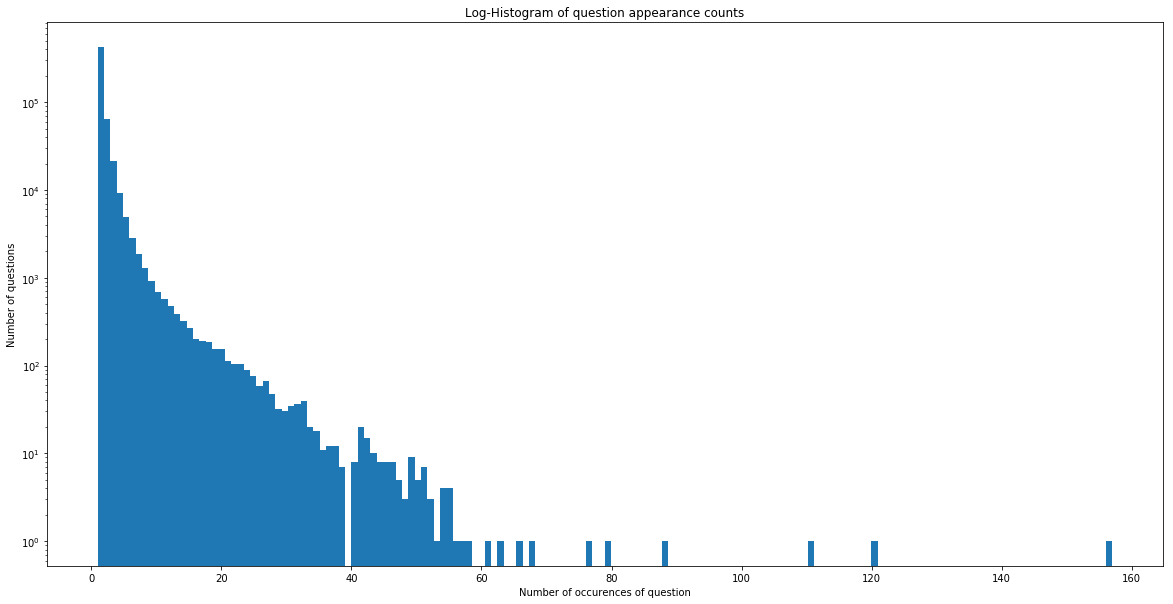
Max number of times a single question is repeated: 157
Duplicate data
There are 0 duplicate rows.
Feature engineering
Constructed few features like:
- freq_qid1 = Frequency of qid1’s
- freq_qid2 = Frequency of qid2’s
- q1len = Length of q1
- q2len = Length of q2
- q1_n_words = Number of words in Question 1
- q2_n_words = Number of words in Question 2
- word_Common = (Number of common unique words in Question 1 and Question 2)
- word_Total =(Total num of words in Question 1 + Total num of words in Question 2)
- word_share = (word_common)/(word_Total)
- freq_q1+freq_q2 = sum total of frequency of qid1 and qid2
- freq_q1-freq_q2 = absolute difference of frequency of qid1 and qid2
Checking how the features word_share and word_Common is going to be helpful -
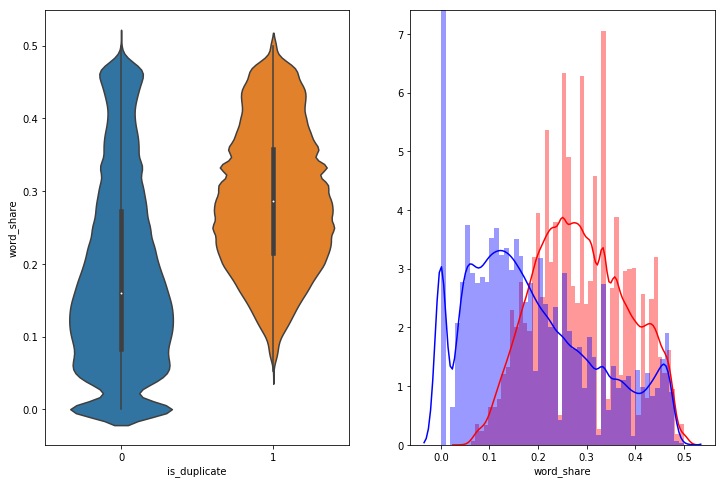
As observed from above plots, the PDFs of word_share for 0 and 1 can be useful as they are neither overlapping completely nor separated apart ideally.
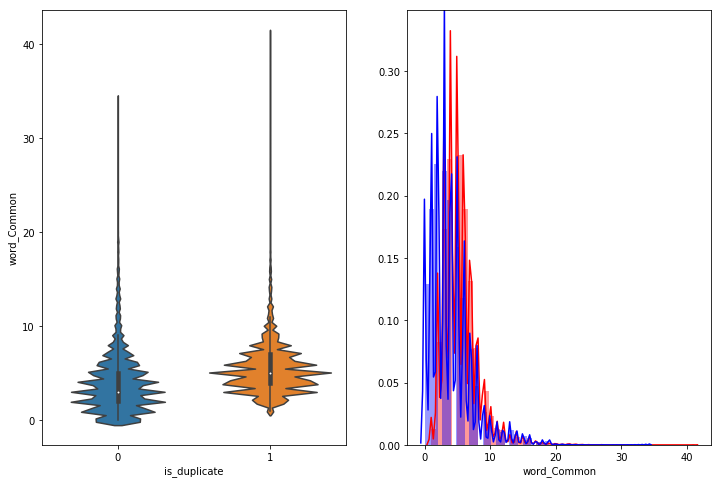
The word_Common doesn’t help much in distinguishing 0 from 1.
Text preprocessing
- Removing html tags
- Removing Punctuations
- Performing stemming
- Removing Stopwords
- Expanding contractions (expanding % symbol to percentage, etc)
Advanced feature engineering
Added 15 more advanced features after tokenization including features from fuzzywuzzy
- cwc_min = common_word_count / (min(len(q1_words), len(q2_words))
- cwc_max = common_word_count / (max(len(q1_words), len(q2_words))
- csc_min = common_stop_count / (min(len(q1_stops), len(q2_stops))
- csc_max = common_stop_count / (max(len(q1_stops), len(q2_stops))
- ctc_min = common_token_count / (min(len(q1_tokens), len(q2_tokens))
- ctc_max = common_token_count / (max(len(q1_tokens), len(q2_tokens))
- last_word_eq = int(q1_tokens[-1] == q2_tokens[-1])
- first_word_eq = int(q1_tokens[0] == q2_tokens[0])
- abs_len_diff = abs(len(q1_tokens) - len(q2_tokens))
- mean_len = (len(q1_tokens) + len(q2_tokens))/2
- fuzz_ratio
- fuzz_partial_ratio
- token_sort_ratio
- token_set_ratio
- longest_substr_ratio = len(longest common substring) / (min(len(q1_tokens), len(q2_tokens))
Feature analysis
Frequency of duplicate question pairs
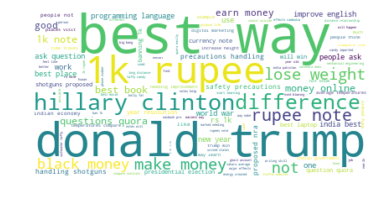
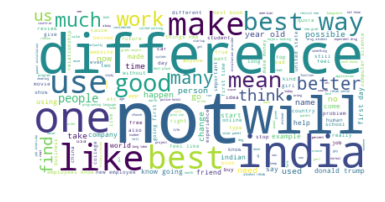
Frequency of non-duplicate question pairs
Pair plot of features [‘ctc_min’, ‘cwc_min’, ‘csc_min’, ‘token_sort_ratio’]
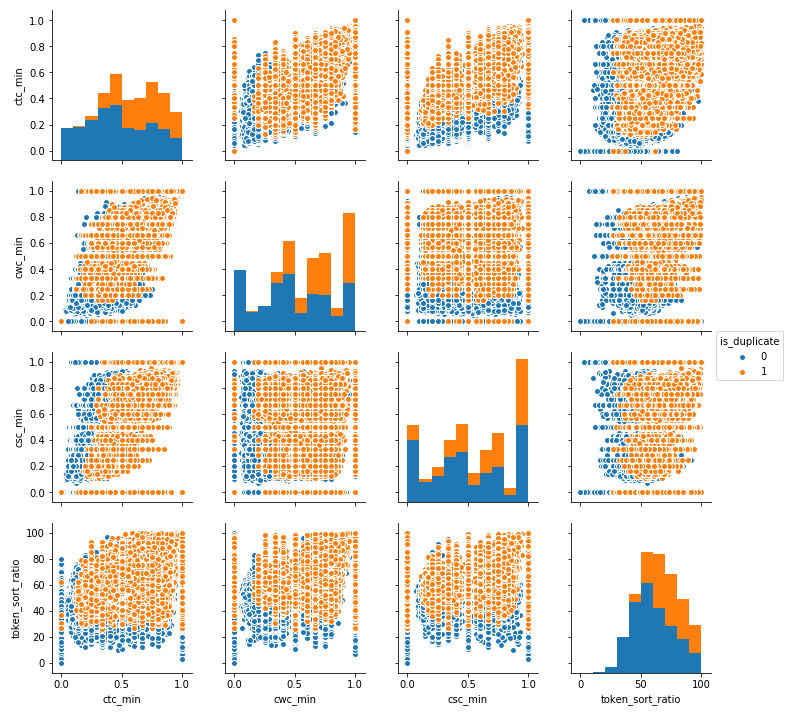
As can be observed from the plots, there lies partial separability among features which can be quite helpful in distinguishing 0 from 1.
Distribution of the token_sort_ratio

The PDFs are not prefectly overlapping, hence it will be a good feature.
Distribution of the fuzz_ratio

Here also, the PDFs are not prefectly overlapping, hence it will be a good feature.
Since there are 15 such features, so let’s take the visualization using T-SNE approach.
Dimensionality reduction by T-SNE
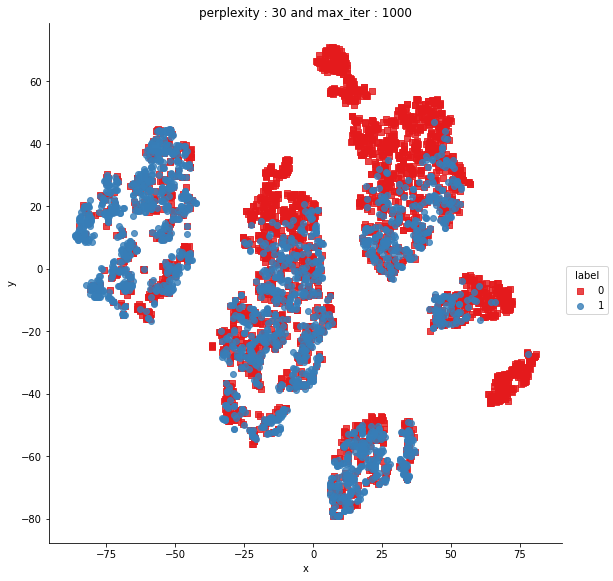
Certainly, we can say that in some cases we can easily separate out 0 from 1. Hence, pointing out that our features will be helpful.
TF-IDF Glove (Global Vectors)
Creating TF-IDF weighted Glove features for question1 and question2.
Glove and Word2Vec builds on simliar core concept which is looking for semantic similarity. Optionally, we can also use Word2Vec.
Now, we have basic features, advanced features and TF-IDF weighted Glove features for each of the questions, making final set of independent features
Machine Learning Model
Loading data
Storing the CSV into a SQLite engine created database (just to explore) and loading up data to initiate the modeling. Next, split data into train-test.
Implementing models
1. Logistic Regression
Implemented LR with hyper-parameter tuning, L2 regularisation, followed by calibrating the score (due to the log-loss which works only on calibrated models and LR may output some un-calibrated data).
Tuned LR results into a log-loss of 0.52 (Also checking overfitting, didn’t occur)
2. Linear SVM
Also implemented linear SVM with a log-loss of 0.489. (Also checking overfitting, didn’t occur)
3. GBDT - XGBoost
Also implemented GBT with a log-loss of 0.35. (Also checking overfitting, didn’t occur)