
Kaggle: Stack Overflow Tag prediction
Problem statement
Suggest the tags based on the question content on Stack Overflow (SO).
Source
Kaggle: Facebook recruiting III keyword extraction
Focus area
To achieve high precision and recall without higher latency keeping in mind that incorrect tags can impact customer experience on SO.
Data source
The data is available on Kaggle and briefly summarised here -
- Train.csv size 6.75 GB, contains 4 columns: Id, Title, Body, Tags.
- Test.csv size 2 GB, contains the same columns but without the Tags, which you are to predict.
Formulating a ML problem
Since for each question (title + body), we need to predict at max 5 tags. Hence, this is a multi-label classification problem. Refer scikit-learn for more information on this topic.
The performance matric on Kaggle for this competition is mean F score which is the weighted average of precision and recall where 1 represents the best value and 0 represents the worst value.
We can also measure Hamming Loss which accounts for the accuracy in a multi-label classification.
Exploratory Data Analysis
Step 1: Loading the data
We start by creating a database using SQLite engine out of given CSV files (just to explore SQLite) with a chunksize of nearly 0.2 million.
Step 2: Checking duplicates
To fetch number of duplicates from .db file, we run following command -
pd.read_sql_query("""SELECT Title, Body, Tags, COUNT(*) as cnt_dup FROM data GROUP BY Title, Body, Tags""")
giving us 1827881 questions as duplicate, nearly 30.29%
| Occurence of duplicate questions | How many such questions |
|---|---|
| 1 | 2656284 |
| 2 | 1272336 |
| 3 | 277575 |
| 4 | 90 |
| 5 | 25 |
| 6 | 5 |
Next, we find the number of times tag appear for each question and find their distribution.
| Occurence of tags | Number of questions |
|---|---|
| 3 | 1206157 |
| 2 | 1111706 |
| 4 | 814996 |
| 1 | 568298 |
| 5 | 505158 |
Finally, duplicates have been removed from the database.
Step 3: Analysis of Tags
Left with nearly 4.2 million question, the number of unique tags came out to be 42048.
I. Plotting total number of times a tag appears in descending order results into a highly right-skewed distribution as shown.
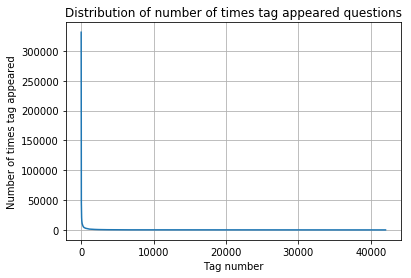
Observations -
- There are total 153 tags which are used more than 10000 times.
- 14 tags are used more than 100000 times.
- Most frequent tag (i.e. c#) is used 331505 times.
- Since some tags occur much more frequenctly than others, Micro-averaged F1-score (Mean F-score) is the appropriate metric.
II. Looking for tags per question

Observations -
- Maximum number of tags per question: 5
- Minimum number of tags per question: 1
- Avg. number of tags per question: 2.899
- Most of the questions are having 2 or 3 tags
III. Frequent tags
To arrive on frequent tags, simple wordcloud is a good choice.

Also, we can look for top-most 20 tags using a bar-chart.

Step 4: Data preprocessing
Following the standard data preprocessing steps-
- Separate out code-snippets from Body (codes can be separated out by looking for
code_body) - Remove Special characters from Question title and description (excluding code)
- Remove stop words (Except ‘C’, since ‘C’ is a programming language)
- Remove HTML Tags using RegEx
- Convert all the characters into lowercase
- Use SnowballStemmer to stem the words
Step 5: Data modeling
Since we are dealing with a multi-label classification problem, it would be easy, if it can be converted into a multi-class classification problem where we can implement commonly known algorithms like kNN, SVM, LR, etc. This article conveys information about the same.
So, let us perform one hot encoding on our tags which will result into nearly 42k columns each representing a tag. Since this has increased the dimension too much, we can follow partial coverage to select only those tags which occur too frequently. Performed on a sample of 1M questions, choosing only top 500 tags are able to cover 90% of questions, whereas choosing only 5500 tags can cover 99% of questions. So, we drop all other tag columns except these 5500.
Next step involves data train-test split in the ratio 80:20.
Featurization
Taking TF-IDF of unigram, bigram and trigrams, tokenization included, results into a sparse matrix of TF-IDF features featured as columns for X_train and X_test against Y_train and Y_test (5500 target columns).
Implementing Logistic Regression: OneVsRest Classifier Since we have a high dimensionality in the data, we prefer LR over SVM, RF or GBDTs, also favoring to its low computational requirements against others.
The final model gave us a mean F-score of 0.34.